Operating room analytics was one of the most challenging parts of our product to design. Our goal was to create a tool that was both easy-to-use and sophisticated.
Role
Senior Product Designer
Timeline and contribution
This case study presents features I was fortunate to be responsible for designing from Jan 2019 - Sep 2019. My work included user research, prototyping, interface design, documentation, and design QA. I worked in close collaboration with PMs, engineers, and hospital administrators.
Problem space
Hospital analytics is complex and hard to attain for Perioperative leaders and other hospital administrators. It was a big piece of what our customers wanted from us so that they could better understand how their ORs and surgeons were performing and where they needed to improve. Our challenge was to allow these Periop leaders and administrators to become more self-sufficient before taking days and sometimes weeks of time from an analyst to get the reports they needed. Often times, these reports were in Excel format.
Outcome
We spent months digging deep into how our customers gathered and understood their data and how we were presenting them with those analytics. Our findings led us to a much more minimal solution that allowed our customers to more quickly understand where they had problem areas. We are continuing to add to this solution today with other features that enhance collaboration among hospital staff.
Live Product
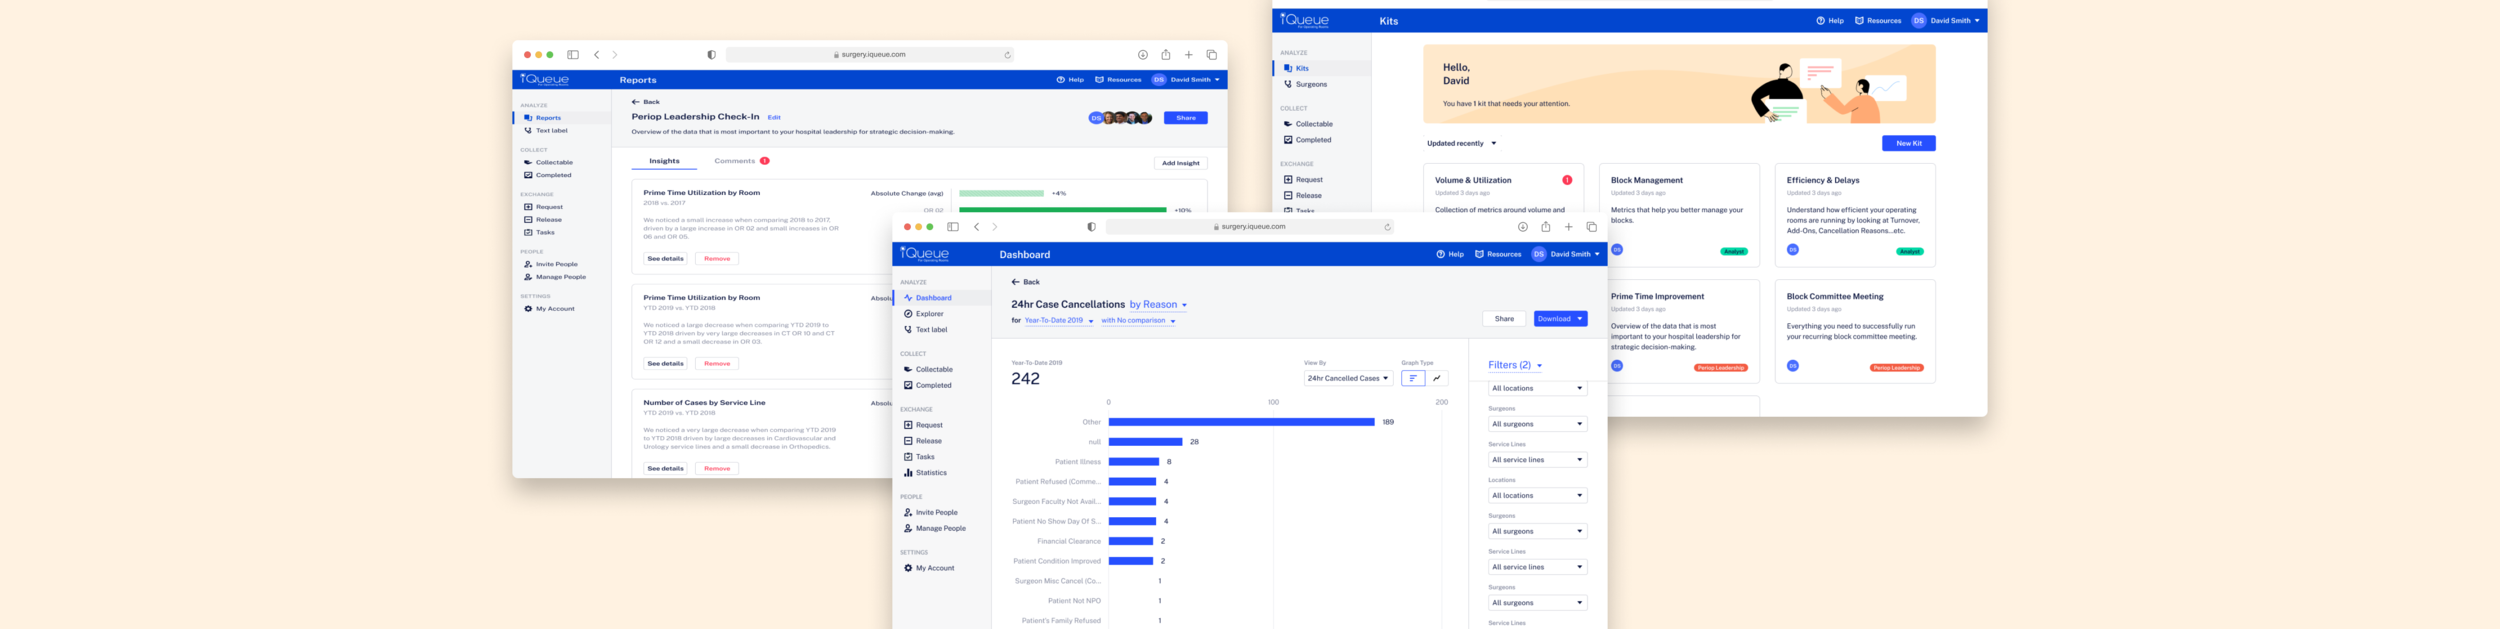
This is a recording of exactly what this product looks like in our customers hands today. We designed this to work similarly to a query builder while still allowing easy comparisons between any dimension and any time period. This query building model is structured as a sentence format and accompanied by a separate filters column. The sentence structure allowed us to communicate complicated functions for the query in a way that could be more easily understood.

Data Display Types
These were some of the variants we explored for how we can best display the data we were providing. From our research, we found our customers were looking at data in a few different category types: ranking, comparison (delta), aggregates, and trends. We then looked at all the different data that they could possibly need and, once categorized, we were able to tell that graphs could either be viewed as a rank

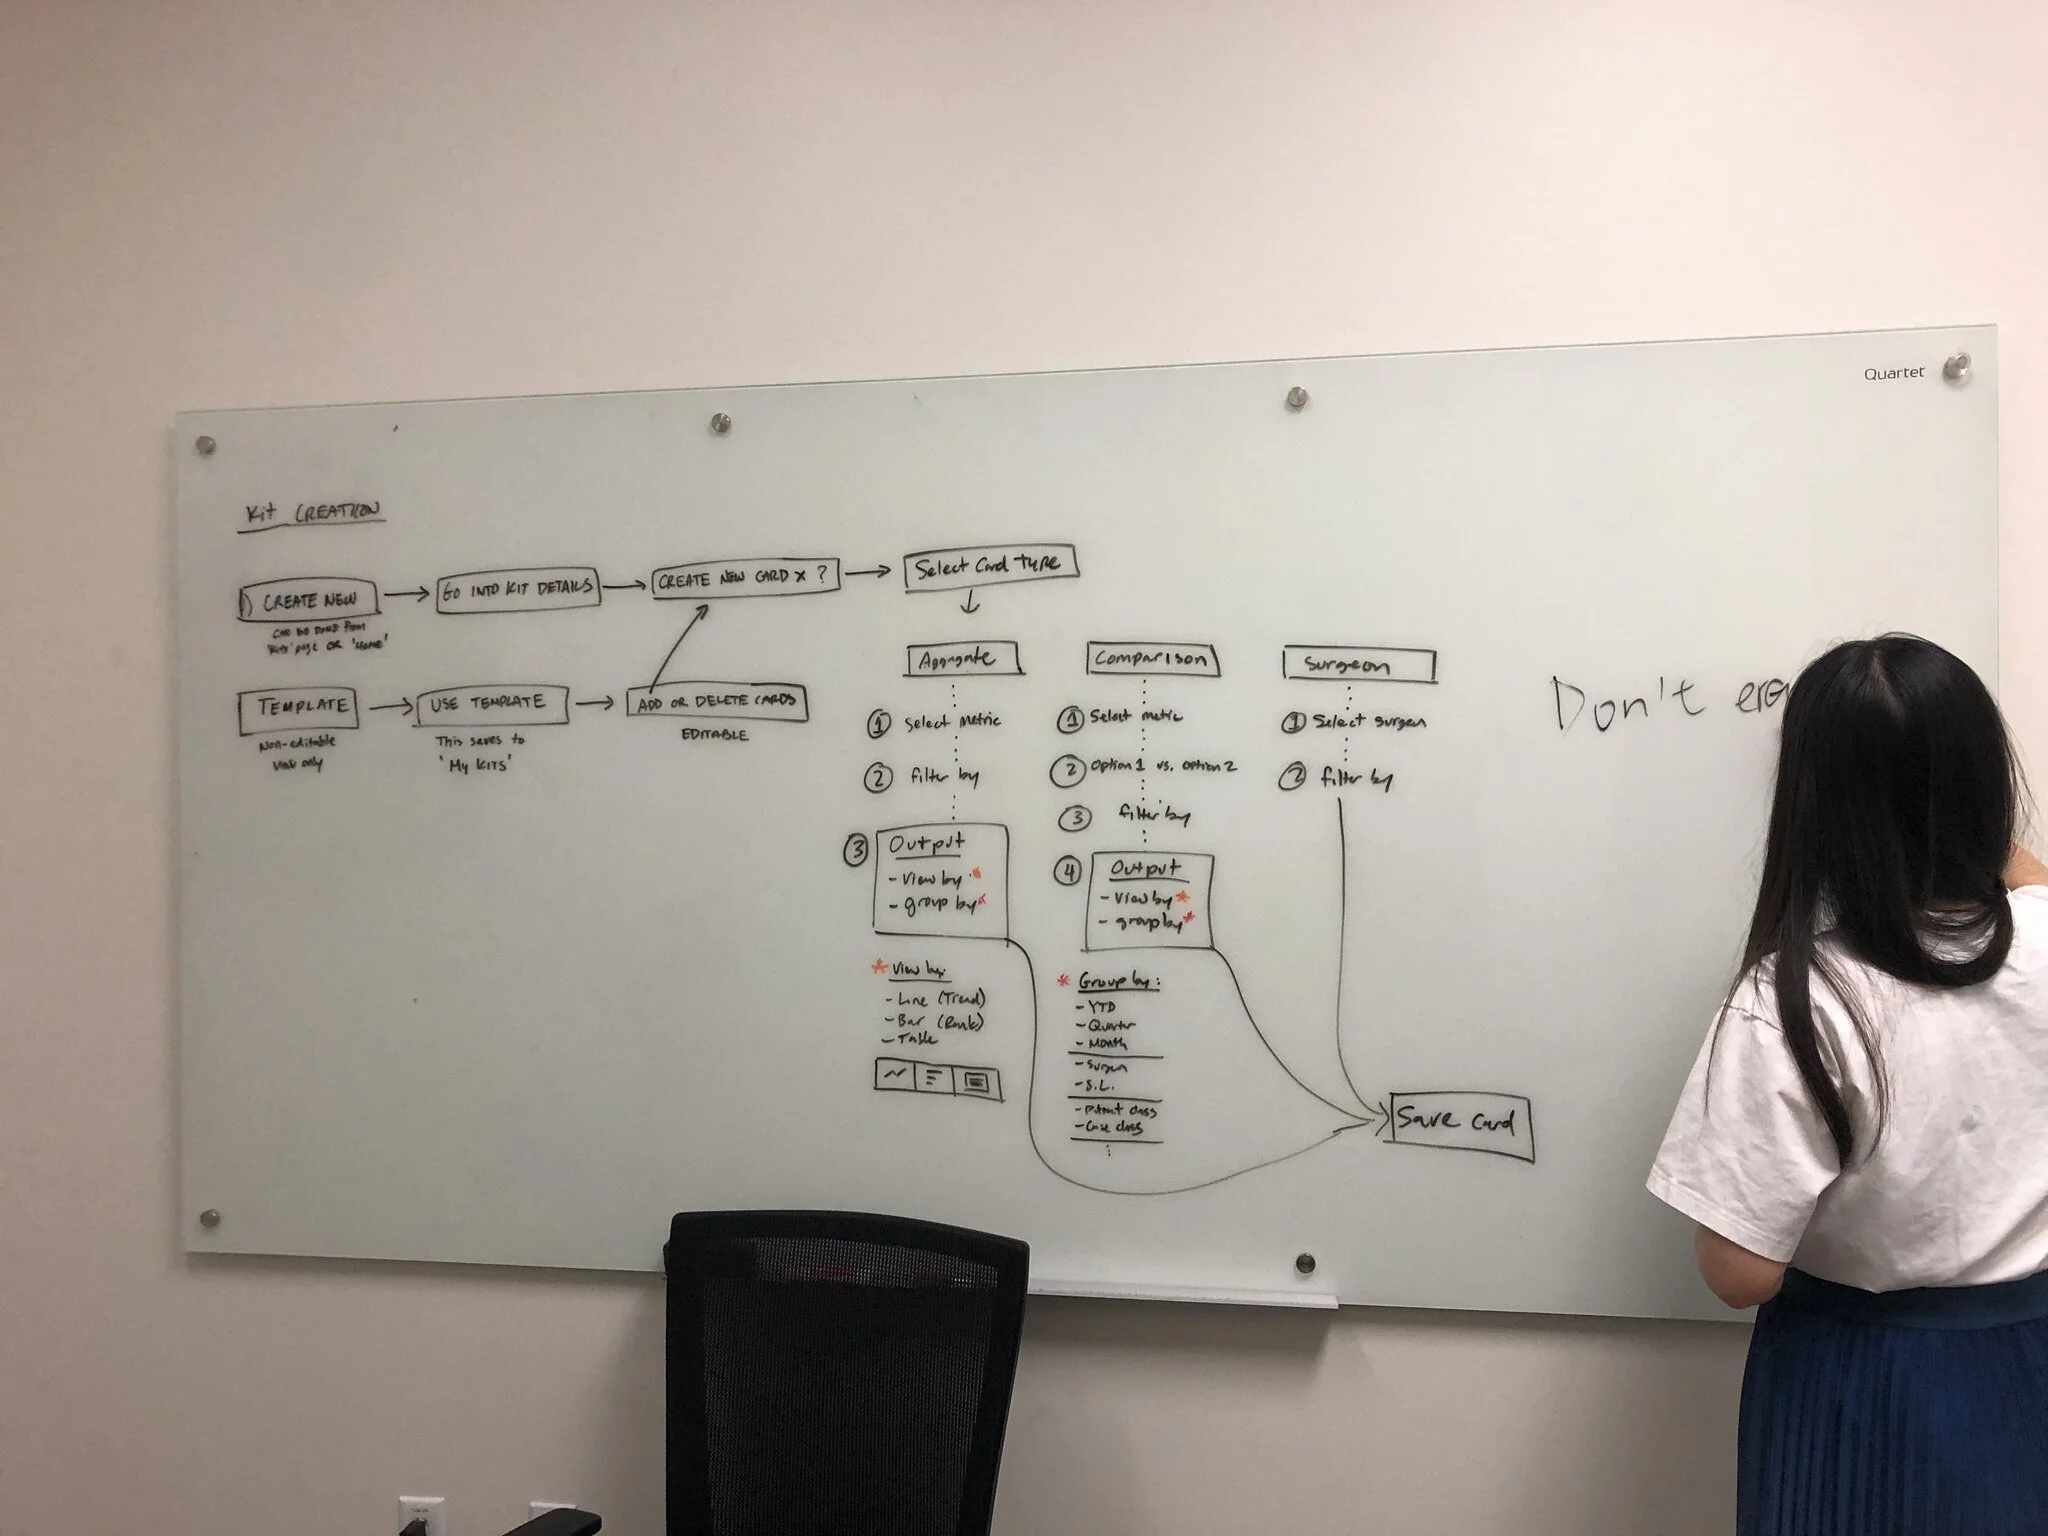
Kits
This part of the solution did not make it into the first roll out, but I thought it was an important piece of the exploration with our customers. This concept was presented to them at our yearly conference in 2019 where we also ran workshops to understand what kind of data administrators cared about. ‘Kits’ was a way for us to pre-package templatized analytics that were very common between hospitals. Credit to my colleague, Julia Wu, who helped create the banner illustration to bring a little life to the design.

Templates
We needed a way to allow users to know which types of templates were made for them. Much like how template sites like Squarespace offer pre-made websites based on what you needed it for, this was meant to target the job type that the user had. Through our interviews, we discovered that Periop leaders looked at very specific metrics due to them being more of a business person for the hospital. They would care about things like case costs and how rooms were utilized. Analysts were slightly different in that they were being told what reports to run by the leaders and thus had a different set of needs.

Query Builder Concept
We knew that we needed some way to build reports so I experimented with some concepts for how that could be done. This concept was a way to do this while also allowing the user to save some screen space so that once the query was done, it would collapse to better highlight the report that is generated from it. Once collapsed, the user can still see some important pieces of what kind of query they ran.

Cards
Cards were a design system component we had that was used frequently throughout the app to express categories of information. Here, we used this component and explored how the anatomy may look when purposed for summarizing different metrics on a users home page. The goal for this was to provide a slightly more social aspect since we discovered that administrators often worked with teams of various roles and responsibilities to make hospital decisions based on data.

Commenting
A big aspect that we wanted to add was a way for admins to talk to each other without having to set up meetings or phone calls. Normally this could take a decent amount of time since some hospital campuses can be spread wide across cities. We wanted to provide them with an efficient way to converse about a specific metric topic and to be able to make quicker decisions.
Behind the scenes


Project Team
This project was a tough one that had a prolonged research period. It couldn’t have been done without the combined effort from my teammates below:
Utkarsh Vaidya, Shan Li, Julia Wu, Leo Chan, and Brendan Mok.